

TL;DR
Our previous research reframed block rewards as a “baseline insurance premium for continuous security services.” This study gives that metaphor an actuarial foundation. The Node Incentive Pool is pre-allocated at 30% of total supply (3.0B OZ) and internally structured as a 2-Tier architecture: a Primary Reward Pool (2.1B OZ, normal operations) and a Sustainability Reserve (0.9B OZ, demand-delay buffer). Annual distribution follows an exponential decay function R(y) = R₀ · e^(−λy), where the decay constant λ = 0.12 is engineered so that even with zero oracle fee revenue, node rewards can be sustained for 7.6 years. Oracle fee revenue merges into node compensation through the 4-way distribution (45/25/15/15) confirmed in our Service Revenue Foundation research. This study mathematically defines the transition safety conditions and emergency protocols governing the convergence of these two revenue streams.
Introduction: Two Rivers, One Reward
Previous studies designed the supply side and demand side of state synchronization economics separately. Service Revenue Foundation established the 3-tier pricing structure and 4-way revenue distribution. Oracle Session Security derived per-node staking requirements of 10M OZ and Phase-specific APY scenarios. Slashing Mathematics completed the security enforcement mechanism with a 5-level slashing framework.
Yet an unresolved junction remains between these studies. The revenue distribution from Service Revenue Foundation applies to oracle fees, while the block rewards from Oracle Session Security originate from a pre-allocated Node Incentive Pool. These two revenue sources differ in pathway, economic character, and how their relative weight shifts over time.
Oracle fees are demand-proportional variable revenue. They grow when network usage increases and shrink when it declines. Block rewards are protocol-guaranteed fixed revenue. Regardless of demand, they are distributed to nodes as long as the network operates.
How do these two rivers converge into a single reward pool? And what mathematical conditions must be satisfied at that confluence for the system to remain sustainable?
This is the design problem of the Revenue-to-Reward Engine. And the first principle of this design is not optimistic assumption, but survivability under pessimistic scenarios.
Figure 1: Dual Revenue Stream Architecture
Part I: Node Incentive Pool Architecture
1.1 Pre-allocation vs Minting: A Design Choice
Blockchain network reward mechanisms fall broadly into two models.
Minting Model: Bitcoin and Ethereum are representative. New tokens are created at each block and distributed to validators. Bitcoin controls emission through a 4-year halving cycle [1], while Ethereum uses post-EIP-1559 burn mechanics to modulate net inflation [2].
Pre-allocation Model: Total supply is fixed at genesis, and rewards are distributed from a pre-reserved pool. Helium implemented a 2-year halving schedule with a 223M HNT hard cap, ensuring emissions decrease over time while maintaining network participation incentives [3].
Oraclizer adopts the pre-allocation model. As stated in our previous research, block rewards are distributed from the Node Incentive Pool rather than newly minted. The rationale is threefold.
First, supply predictability. Total supply of 10B OZ is fixed at genesis, with no inflation-driven dilution. Both node operators and token holders can predict future supply with precision.
Second, security threshold stability. In our Security Threshold Formula, the term S_total · p depends on token price. A minting model creates downward price pressure through supply expansion, weakening the security threshold. Pre-allocation blocks this pathway.
Third, L3 architecture alignment. Oraclizer is an L3 solution, not an L1. L1 chains justify high inflation because they secure the entire chain, but L3 only needs to secure state synchronization services. Reward magnitude should be proportionally constrained, and a finite Incentive Pool naturally reflects this.
1.2 The 30% Allocation: Sizing the Reward Pool
The token allocation designates 30% of total supply (3.0B OZ) as node incentives. Determining this pool’s size involves two competing constraints.
On one hand, a larger pool ensures longer-term reward sustainability. On the other, an oversized pool compresses other essential allocations (ecosystem development, team, liquidity). The 30% ratio was determined in balance with the remaining allocation: ecosystem 25%, foundation reserve 15%, Security Reserve Pool 12%, team 10%, public sale 3.3%, liquidity 3%, airdrop 1.5%, and private 0.2%.
This study’s task is to design how to internally structure the given 3.0B OZ for maximum operational safety.
1.3 The 2-Tier Architecture: Primary + Sustainability Reserve
Operating 3.0B OZ as a single pool means relying entirely on a single decay function. A low decay rate keeps early rewards generous but increases late-stage depletion risk; a high decay rate secures late-stage safety but weakens early node attraction.
To resolve this dilemma, we introduce a 2-Tier structure.
Primary Reward Pool (2.1B OZ, 21% of total supply): The main pool from which block rewards are distributed during normal operations. Distribution decreases according to the exponential decay function.
Sustainability Reserve (0.9B OZ, 9% of total supply): A buffer pool that replenishes the Primary when demand growth falls short of expectations. Activated only through governance approval.
The 70/30 ratio is grounded in the following logic. The Primary Pool alone can sustain distribution for approximately 4.5 years without any oracle fee revenue. This period covers all of Phase 1 (~2 years) and through mid-Phase 2. If oracle fee revenue has not grown meaningfully by this point, a fundamental demand problem exists, and governance intervention (whether to activate the Sustainability Reserve) should be triggered.
Including the Sustainability Reserve extends total survival to 7.6 years, reaching early Phase 3. If oracle fees remain insufficient even at this point, transition to a smaller equilibrium (fewer nodes, lower TVL) becomes unavoidable. The Reserve is not an “infinite lifeline” but a mechanism that provides temporal room for structural adjustment.
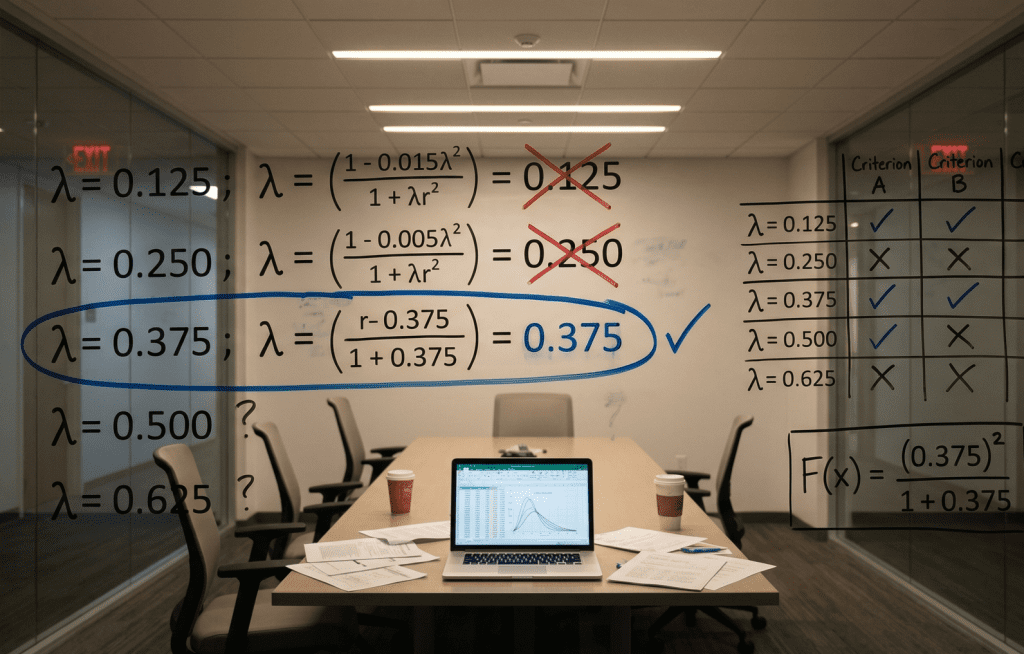
Candidate decay constants tested against boundary conditions on a meeting room glass wall, narrowing toward the value that satisfies all three.
1.4 Exponential Decay Model
The annual distribution function:
$$R(y) = R_0 \cdot e^{-\lambda y} \tag{1}$$
where R(y) is the year-y annual distribution in OZ, R₀ is the initial annual distribution (600M OZ, 6% in Phase 1), and λ is the decay constant.
Cumulative distribution through year y:
$$C(y) = \frac{R_0}{\lambda}(1 – e^{-\lambda y}) \tag{2}$$
Three boundary conditions determine λ.
Boundary Condition 1 (Phase alignment): The annual distribution rate must fall to 2% or below of total supply by year 10.
$$R(10) = R_0 \cdot e^{-10\lambda} \leq 200M \quad \Rightarrow \quad \lambda \geq \frac{\ln 3}{10} \approx 0.110$$
Boundary Condition 2 (Primary Pool scope): 5-year cumulative distribution under the decay function must remain within the Primary Pool (2.1B), meaning at least 5 years of operation without touching the Reserve.
$$C(5) = \frac{R_0}{\lambda}(1 – e^{-5\lambda}) \leq 2.1B$$
Boundary Condition 3 (Total pool durability): The full 3.0B OZ must sustain distribution for at least 7 years without any oracle fee revenue.
$$C(7) = \frac{R_0}{\lambda}(1 – e^{-7\lambda}) \leq 3.0B$$
Searching for λ values satisfying all three simultaneously:
| λ | Year 10 Rate | 5yr Cumulative | 7yr Cumulative | Primary OK? | 7yr Total OK? |
|---|---|---|---|---|---|
| 0.10 | 2.21% | 2.36B | 3.04B | ✗ | ✗ |
| 0.11 | 2.00% | 2.31B | 2.93B | ✗ | ✓ |
| 0.12 | 1.81% | 2.26B | 2.84B | ✓ | ✓ |
| 0.13 | 1.64% | 2.21B | 2.75B | ✓ | ✓ |
| 0.14 | 1.48% | 2.16B | 2.67B | ✓ | ✓ |
Selected parameter: λ = 0.12
This value satisfies all three boundary conditions while aligning naturally with Phase-specific distribution targets. Values of λ ≥ 0.13 extend the Primary-only operation period but cause block rewards to drop steeply in years 3-4. λ = 0.12 represents the equilibrium between early reward retention and long-term durability.
1.5 Annual Distribution Profile
The Phase-aligned distribution profile with confirmed parameters (R₀ = 600M, λ = 0.12):
| Year | Annual Dist. (M OZ) | Rate | Cumul. (M OZ) | Pool Left (M OZ) | Pool Status | Phase |
|---|---|---|---|---|---|---|
| 1 | 565 | 5.32% | 565 | 2,435 | Primary | Phase 1 |
| 2 | 502 | 4.72% | 1,067 | 1,933 | Primary | Phase 1 |
| 3 | 445 | 4.19% | 1,512 | 1,488 | Primary | Phase 2 |
| 4 | 395 | 3.71% | 1,906 | 1,094 | Primary | Phase 2 |
| 5 | 350 | 3.29% | 2,256 | 744 | Reserve Entry | Phase 2 |
| 6 | 310 | 2.92% | 2,566 | 434 | Reserve | Phase 3 |
| 7 | 275 | 2.59% | 2,841 | 159 | Reserve | Phase 3 |
| 10 | 192 | 1.81% | 3,494 | — | (Fee transition) | Phase 3 |
Two facts stand out. First, the natural Phase alignment of distribution rates. The decay function’s outputs closely match the Phase-specific targets established in previous research (5-7% → 3-4% → 1-2%). Second, Reserve entry occurs at Year 5. This calculation assumes the worst case of zero oracle fee revenue. In practice, fee revenue flowing in during Phase 2 (years 3-5) will substantially slow pool depletion.
| Year | Dist. (M) | Rate | Pool Left | Phase |
|---|---|---|---|---|
| 1 | 565 | 5.32% | 2,435 | P1 |
| 2 | 502 | 4.72% | 1,933 | P1 |
| 3 | 445 | 4.19% | 1,488 | P2 |
| 5 | 350 | 3.29% | 744 | Reserve |
| 7 | 275 | 2.59% | 159 | P3 |
| 10 | 192 | 1.81% | — | P3 |
| 15 | 105 | 0.99% | — | P3+ |
Figure 2: Node Incentive Pool Decay Profile with 2-Tier Structure
1.6 Epoch-based Discrete Implementation
The continuous function (1) is a theoretical model. In practice, distribution occurs in discrete Epoch units. Converting annual distribution to per-block:
$$r_{block}(y) = \frac{R(y)}{N_{blocks/year}} \tag{3}$$
Year 1: r_block ≈ 35.8 OZ/block. Year 5: ≈ 22.2 OZ/block. Year 10: ≈ 12.2 OZ/block.
The decay function is recalculated at each Epoch transition (D-quencer epoch boundaries). Within an Epoch, a fixed per-block reward applies. This is a pragmatic approach that minimizes smart contract complexity while approximating the decay effect.

Actuarial textbook open beside handwritten notes connecting reward pool decay to insurance premium theory.
Part II: The Actuarial Foundation of Block Rewards
2.1 From Metaphor to Model
Our previous research reframed block rewards as a “baseline insurance premium for continuous security services.” The metaphor was intuitive but not rigorous. In actuarial science, premium calculation follows a specific mathematical framework. For block rewards to be genuinely termed “premiums,” a corresponding mathematical structure is necessary.
The traditional net premium calculation is grounded in the equivalence principle [4]:
$$\text{APV(Premiums)} = \text{APV(Benefits)}$$
The actuarial present value of premiums must equal the actuarial present value of benefits.
2.2 Block Rewards as Continuous Premiums
Applying this principle to block rewards, the “insurance” that node operators provide to the network is twofold.
Preventive Insurance: Locking staked capital raises the cost of attack, deterring attacks themselves. This insurance has value even when no attack occurs, just as a lock has value even when it never stops a thief.
Post-hoc Insurance: Slashing mechanisms enforce economic punishment when violations occur. The 5-level slashing framework designed in Slashing Mathematics serves this function.
Block rewards are primarily premiums for preventive insurance:
$$\Pi_{block} = \Pi_{preventive} + \Pi_{operational} \tag{4}$$
where Π_preventive is the preventive premium (capital opportunity cost compensation) and Π_operational is operational cost compensation (infrastructure, monitoring).
2.3 Preventive Premium Derivation
The preventive premium must compensate node operators’ opportunity cost of capital.
$$\Pi_{preventive} = S_{min} \cdot p \cdot r_{opportunity} \cdot N_{nodes} \tag{5}$$
Our previous research derived the survival threshold at ~6% APY. This value reflected the sum of DeFi stablecoin yields (3-5%), Ethereum staking yields (currently around 3% [5]), and operational risk premium. Thus r_opportunity ≈ 0.06 serves as the opportunity cost floor.
Phase 1 (20 nodes, p = $0.01):
$$\Pi_{preventive} = 10M \times \$0.01 \times 0.06 \times 20 = \$120{,}000/\text{year}$$
Actual Phase 1 block rewards are approximately 565M OZ annually = $5,654,000, roughly 47 times the pure opportunity cost compensation. This gap reflects three factors: uncertainty premium (token price volatility, early-stage technical risk), incentive threshold fulfillment (targeting 12-15% rather than the 6% survival floor to attract new operators), and early demand absence compensation (block rewards covering limited oracle fee revenue in Phase 1).
Within this structure, the decay of block rewards is a natural logical consequence. As the network matures, the uncertainty premium diminishes and oracle fees replace opportunity cost compensation, so block reward “premiums” should decrease.
2.4 Reserve Adequacy
In actuarial science, reserve adequacy is the core metric ensuring an insurer’s solvency. We apply the same principle to the Node Incentive Pool.
Pool remaining at arbitrary time y:
$$P(y) = P_0 – C(y) = P_0 – \frac{R_0}{\lambda}(1 – e^{-\lambda y}) \tag{6}$$
Primary Pool adequacy: With P₀ = 2.1B, the maximum y where P(y) ≥ 0 is approximately 4.5 years.
Total Pool adequacy: With P₀ = 3.0B, the maximum y is approximately 7.6 years.
Compared to the initial design (1.5B, λ = 0.154) where this value was 3.2 years, this represents a 2.4× safety improvement. The significance is not merely “lasting longer.” 3.2 years meant depletion during the Phase 1-2 transition, a structure that bet everything on oracle fee growth. 7.6 years provides runway through early Phase 3, maintaining network stability regardless of demand growth velocity.
Part III: The Revenue-to-Reward Engine
3.1 Dual Stream Convergence
Total compensation received by a node is the sum of two revenue sources:
$$C_{node}(y) = C_{block}(y) + C_{fee}(y) \tag{7}$$
Block reward pathway: Node Incentive Pool → per-block distribution → node
$$C_{block}(y) = R(y) = R_0 \cdot e^{-\lambda y} \tag{8}$$
Oracle fee pathway: Customer payment → 4-way distribution → node reward pool (45%)
$$C_{fee}(y) = F(y) \times 0.45 \tag{9}$$
where F(y) is total oracle fee revenue in year y. The remaining 55% is distributed to operations (25%), insurance (15%), and development (15%), as confirmed in Service Revenue Foundation.
3.2 Fee Growth Requirements
Our previous research established Phase-specific block reward to oracle fee ratios: Phase 1 at 80-85%:15-20%, Phase 2 at 50-60%:40-50%, and Phase 3 at 20-30%:70-80%.
Combining these ratios with the block reward decay function yields the required oracle fee level at each Phase transition:
| Phase Transition | Year | Block Reward (M OZ) | Target Ratio | Required Oracle Fee (M OZ) |
|---|---|---|---|---|
| Mid-Phase 1 | 1 | 565 | 82.5:17.5 | 120 |
| Phase 1→2 | 2 | 502 | 55:45 | 411 |
| Mid-Phase 2 | 3.5 | 467 | 45:55 | 571 |
| Phase 2→3 | 5 | 350 | 25:75 | 1,050 |
Crucially, these figures represent “necessary conditions for transition safety” rather than targets. Even when fee growth falls short, the 2-Tier pool structure serves as a buffer. This is the fundamental difference from the previous design.
3.3 The Sustainability Condition
The core condition for system sustainability: if total node compensation falls below the survival threshold, node exodus begins.
Sustainability Condition:
$$\frac{C_{node}(y)}{S_{staked}(y)} \geq r_{survival} \quad \forall y \tag{10}$$
where r_survival = 0.06 (6% APY survival threshold).
We verify this condition across three scenarios.
Normal Case (100% of target fee growth): Survival threshold exceeded by wide margin across all Phases. Approximately 82% APY at Year 10.
Slow Growth (50% of target fee growth): Threshold still exceeded across all Phases. Approximately 46% APY at Year 10. In the initial design (1.5B pool), this scenario would have entered the danger zone by years 3-4.
Demand Failure (10% of target fee growth): Even in this worst-case scenario, the survival threshold is exceeded through Year 10 (approximately 17% APY). This is the safety margin created by the 2-Tier structure and the slower decay at λ = 0.12.
Figure 3: Transition Safety and Emergency Protocol
3.4 Transition Safety Analysis
Identifying the risk interval where the sustainability condition (10) is most likely violated.
Transition Safety Condition:
$$\left|\frac{dC_{block}}{dy}\right| \leq \frac{dC_{fee}}{dy} \tag{11}$$
The rate of block reward decline:
$$\frac{dC_{block}}{dy} = -\lambda R_0 e^{-\lambda y} = -\lambda R(y)$$
Year 1: |dC_block/dy| = 0.12 × 565M = 67.8M OZ/year
This means oracle fees must grow by at least 67.8M OZ annually to maintain transition safety. This is 27% lower than the previous design’s requirement (λ = 0.154 demanded 92.4M OZ/year). By lowering the decay constant, the pressure on fee growth is reduced in tandem.
3.5 Fee Revenue Recycling
As a supplementary sustainability mechanism, a portion of oracle fee revenue can be recycled into the Sustainability Reserve.
$$P_{reserve}'(y) = P_{reserve}(y) + \alpha_{recycle} \cdot F(y) \cdot 0.15 \tag{12}$$
This mechanism operates through governance. Initially α_recycle = 0 (development investment takes priority), activating only when the Sustainability Reserve is drawn upon. Specific thresholds and recycling ratios will be confirmed alongside insurance pool sizing in our forthcoming Insurance and Recovery Economics research.
Separately, a deflationary mechanism based on service fee burns will affect long-term token economics, but optimal burn ratios will be derived in conjunction with token velocity and circulation analysis in the Pricing Calibration research.
Part IV: Depletion Scenarios and Emergency Protocols
4.1 Depletion Timeline Under Scenarios
In the 2-Tier structure, depletion occurs in two stages.
| Scenario | Primary Depletion | Reserve Depletion | Total Survival |
|---|---|---|---|
| No Fee (worst case) | 4.5 years | 7.6 years | 7.6 years |
| Fee 50% | ~6-7 years | 10+ years | 10+ years |
| Fee 100% (normal) | Effectively never | Unused | Indefinite |
Compared to the initial design (1.5B, λ = 0.154) where no-fee survival was 3.2 years, this represents a 2.4× improvement. The more important difference is qualitative. 3.2 years means crisis onset within Phase 1. 7.6 years means crisis onset after the network has entered its maturity stage.
4.2 Emergency Protocol: Three-Stage Response
A three-stage emergency protocol based on total Node Incentive Pool (3.0B OZ) remaining balance.
Stage 1: Yellow Alert (pool remaining < 25%, approximately Year 5)
- Temporary 50% upward adjustment of decay rate
λ' = λ × 1.5to slow distribution - Governance vote required for approval
- Node operators notified at least 1 Epoch in advance
Stage 2: Orange Alert (pool remaining < 10%, approximately Year 6.5)
- Immediate switch to minimum-level rewards (Phase 3 target of 1-2%)
- Fee Revenue Recycling forced activation (
α_recycle = 0.5) - Node expansion paused (new node onboarding restricted)
- Emergency governance session convened
Stage 3: Red Alert (pool remaining < 3%, approximately Year 7.3)
- Block rewards reduced to minimum security maintenance level
- Emergency transfer from insurance pool to Reserve (maximum 30% of insurance pool)
- Network contraction permitted (down to Phase 1 minimum of 20 nodes)
- Long-term restructuring plan initiated
4.3 Limits of the Emergency Protocol
The emergency protocol is a time-buying mechanism, not a fundamental solution. In a Demand Failure scenario, it provides roughly 12-18 months of additional survival time. If demand cannot be recovered within that window, the system must transition to a smaller equilibrium: fewer nodes, lower TVL, narrower service scope, but sustainable.
From a design standpoint, graceful degradation is always preferable to catastrophic failure. The true value of the 2-Tier structure lies not in its efficiency under optimal scenarios, but in its survivability under pessimistic ones.
Part V: Synthesis and Confirmation
5.1 Confirmed Parameters
| Parameter | Value | Basis |
|---|---|---|
| Node Incentive Pool | 3.0B OZ (30% of total supply) | Token allocation alignment |
| Primary Reward Pool | 2.1B OZ (21%) | 70/30 internal ratio |
| Sustainability Reserve | 0.9B OZ (9%) | Demand-delay buffer |
| Decay constant λ | 0.12 | 3 boundary conditions satisfied |
| Initial annual distribution R₀ | 600M OZ (6%) | Phase 1 distribution rate from Oracle Session Security |
| Year 1 per-block reward | ~35.8 OZ | λ = 0.12 applied |
| Year 10 per-block reward | ~12.2 OZ | Decay function applied |
| No-fee survival duration | 7.6 years | Total pool basis |
| Primary-only operation period | 4.5 years | Without Reserve |
| Block reward distribution method | Pool distribution (no new minting) | Principle maintained from Oracle Session Security |
5.2 Revenue-to-Reward Flow Summary
The complete revenue-to-reward flow:
- Block reward pathway: Primary Reward Pool (2.1B OZ) → Epoch-based decay function application → per-block distribution → node
- Reserve pathway: Sustainability Reserve (0.9B OZ) → governance-approved Primary replenishment → node
- Oracle fee pathway: Customer payment (OZ token) → 4-way distribution → node reward pool (45%) → node
- Recycling pathway: Development pool (15%) → governance decision → Reserve replenishment (emergency)
- Slashing pathway: Slashing proceeds → burn 40% + insurance pool 50% + whistleblower 10% (confirmed in Slashing Mathematics)
5.3 APY Verification with Decay
Verifying previous APY estimates with the confirmed decay function. All figures use the conservative token price assumption of p = $0.01.
Year 1 (Phase 1, 20 nodes): Block rewards of ~565M / 20 = 28.3M OZ/node, plus estimated oracle fees of ~3M OZ/node. APY well above the survival threshold, aligning with the Normal Case range of 15-22% from Oracle Session Security.
Year 5 (Phase 2-3, 50 nodes): Block rewards of ~350M / 50 = 7.0M OZ/node, plus target oracle fees of ~8.6M OZ/node. APY exceeds the survival threshold.
Year 10 (Phase 3, 100 nodes): Block rewards of ~192M / 100 = 1.9M OZ/node, plus target oracle fees of ~7.7M OZ/node. APY exceeds the survival threshold. Even in the Demand Failure scenario (fee at 10% of target), APY remains above the 6% floor through Year 10.
5.4 Open Questions
Unresolved problems from this study:
1. Per-node differential distribution. The criteria for distributing block rewards and oracle fees to individual nodes remain undefined. Options include equal distribution, performance-based, and staking-proportional approaches. This will be addressed in the next study on node compensation frameworks.
2. Fee Revenue Recycling governance. Specific parameters for recycling ratios and activation conditions will be confirmed alongside insurance pool sizing in the forthcoming insurance and recovery economics research.
3. Token price volatility impact. This analysis assumes a fixed p = $0.01. Dollar-denominated APY varies significantly with price fluctuations. Dynamic reward adjustment mechanisms, analogous to the dynamic slashing calibration from Slashing Mathematics, may be warranted.
4. Delegated staking reward distribution. The reward split structure between delegators and validators will be designed in the node compensation framework.
5. Burn mechanism interactions. The impact of service fee-based burns on token velocity and reward pool durability will be analyzed holistically in the pricing calibration research.
For the staking architecture and Phase-specific APY framework underlying this study, see Oracle Session Security: Staking for Continuous State Protection on our research site.
Conclusion
This study designed the structure through which the two revenue sources of state synchronization economics, block rewards and oracle fees, converge into a unified compensation system.
The Node Incentive Pool is 3.0B OZ (30% of total supply), internally operating as a 2-Tier architecture: Primary Reward Pool (2.1B, 21%) and Sustainability Reserve (0.9B, 9%). Distribution follows the exponential decay function R(y) = 600M · e^(−0.12y), which naturally aligns with Phase-specific rate targets (6% → 3-4% → 1-2%).
The core design principle is survivability under pessimistic scenarios. Even with zero oracle fee revenue, node rewards can be sustained for 7.6 years. Under a Demand Failure where fees reach only 10% of target, the survival threshold (6% APY) is maintained through Year 10. This safety margin represents a 2.4× improvement over the initial design.
Block rewards’ actuarial character has been formalized. Applying insurance equivalence principles, we demonstrated mathematically that block rewards are “preventive premiums” compensating node operators’ capital opportunity cost and uncertainty premium. The decay function is a natural consequence of this logic: as the network matures, uncertainty diminishes, so premiums should decrease.
The next study will address the detailed mechanism for distributing this reward pool to individual nodes: the question of “who receives how much.”
Disclaimer: This analysis is a research study for mathematically verifying the economic sustainability of state synchronization mechanisms. All parameters, formulas, and APY projections are theoretical estimates under specific assumptions and may be revised as research progresses. This does not constitute investment advice or guarantee of returns.
References
[1] Bitcoin Block Reward Halving Countdown. https://www.bitcoinblockhalf.com/
[2] Buterin, V. (2021). EIP-1559: Fee market change for ETH 1.0 chain. https://eips.ethereum.org/EIPS/eip-1559
[3] Helium Documentation. The Helium Network Token. https://docs.helium.com/tokens/hnt-token/
[4] Bowers, N.L., et al. (1997). Actuarial Mathematics. Society of Actuaries.
[5] Grayscale Research. (2025). Staking 101: Secure the Blockchain, Earn Rewards. https://research.grayscale.com/reports/staking-101-secure-the-blockchain-earn-rewards