
TL;DR
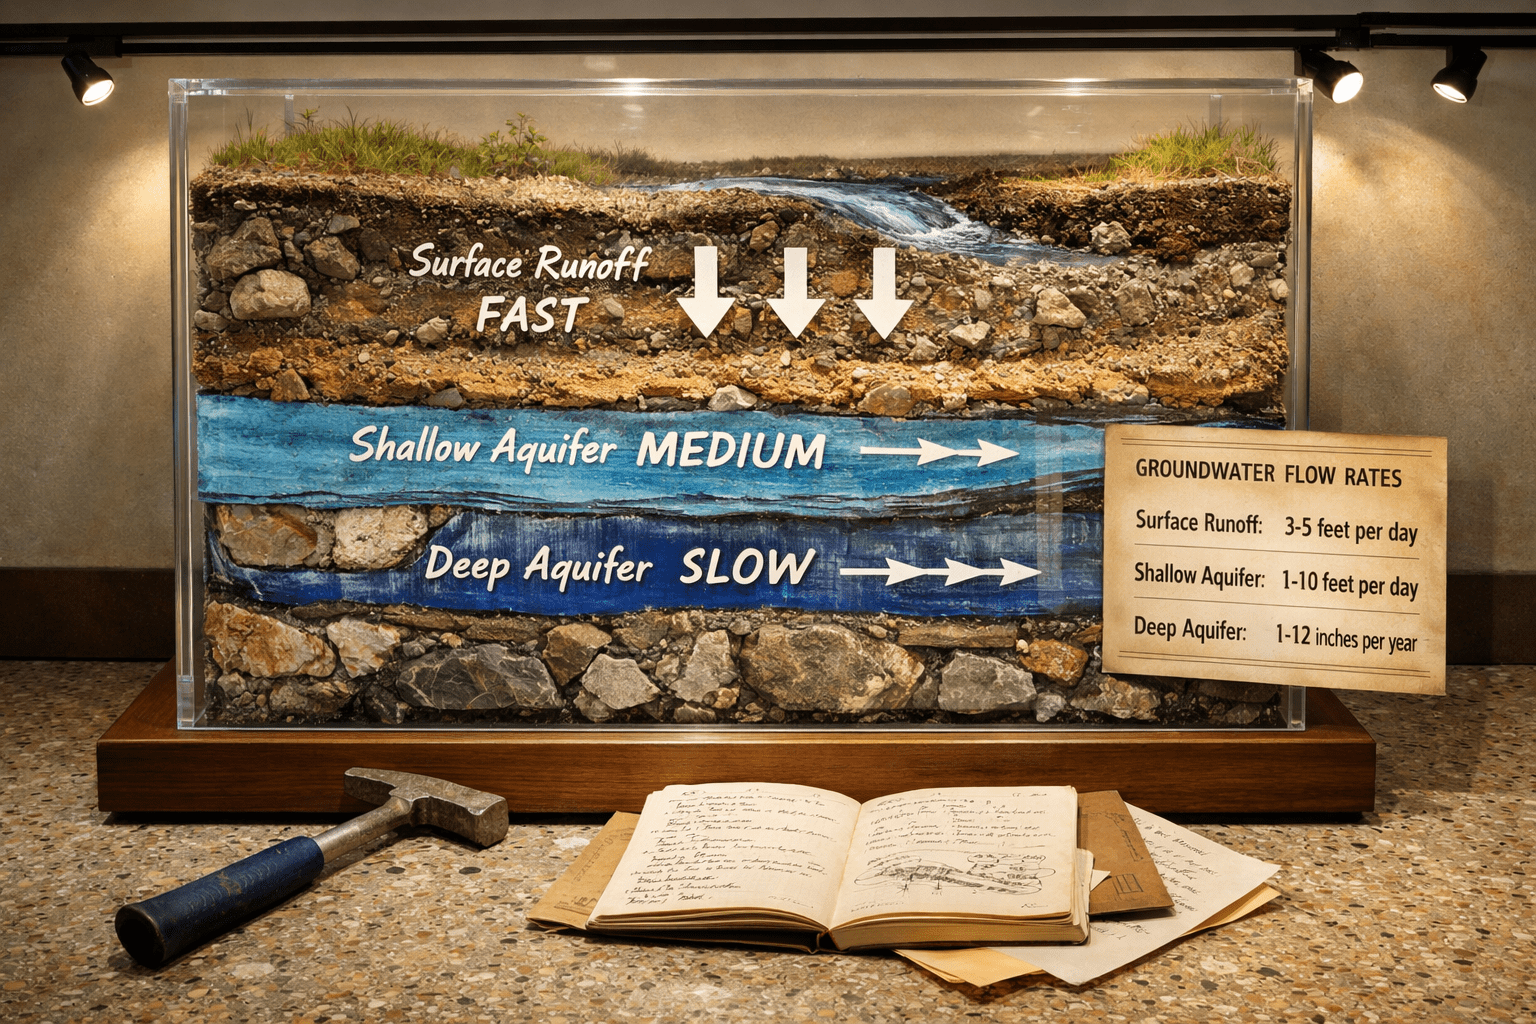
In the State Subscription economy, tokens circulate at three distinct velocities. Pay-per-sync creates rapid circulation through immediate consumption, Growth Credit generates medium-speed flow via prepayment and gradual utilization, and Enterprise Subscription produces slow circulation through long-term lockup. This multi-velocity token flow structure is not merely a design choice but an essential characteristic of the State Subscription blockchain economic model. Block rewards serve as the foundational supply source for all circulation, functioning as the heartbeat that keeps the network operational even during moments without transactions. The harmonious coexistence of three velocities simultaneously achieves system stability, node revenue predictability, and user accessibility, forming the foundation for the insurance pool mechanism and dynamic adjustment systems to be designed in future research.
The Origin of Circulation: Where Do Tokens Come From?
In our previous research, we designed three pricing models: Pay-per-sync offers 10 Sync Units for $1, Growth provides 1,200 Units monthly for $85, and Enterprise offers an 8,000 Unit Cap for $450 per month. While finalizing these prices, we naturally confronted a more fundamental question: Where do tokens originate?
Just as discussing a river’s flow naturally leads to mentioning its source, the same applies to token circulation.
Block Rewards: The Wellspring of Circulation
In traditional blockchain networks, the answer is straightforward. With each block creation, the protocol issues predetermined rewards; this is the network’s fundamental “heartbeat.” Oraclizer is no exception. Block rewards represent the starting point of all token circulation and the base layer upon which the State Subscription economy operates.
Block rewards are the wellspring, while oracle fees are rainwater. Both flow into the river (token economy), but their sources differ.
Block rewards hold special significance in the State Subscription economy compared to traditional blockchains:
Predictable Base Revenue: Earlier research revealed that Heavy-frequency sessions cause 15-25% losses for nodes. However, even during moments without any Pay-per-sync users, node operators secure base revenue through block rewards. This becomes particularly crucial during the early stages of oracle state synchronization as a new service.
Circulation Seed: Even when Enterprise subscription fees remain locked long-term and Growth Credits haven’t been consumed yet, block rewards create immediate token circulation. Even empty blocks supply tokens to the network.
Foundation of System Stability: Protocol-level guaranteed constant token supply acts as a buffer absorbing volatility created by three different pricing models.
The specific inflation schedule, reduction rate, and distribution mechanism among nodes for block rewards will be designed in future research alongside security requirements and staking mechanisms. What we must clarify now is not simply that block rewards “exist,” but that they serve as the foundational supply source for the entire State Subscription economy’s token circulation.
Three Velocities, One System
Looking at the three pricing models designed in our previous research, we initially thought of them simply as “products at different price points.” However, as we began modeling token flow, we made a remarkable discovery: they create fundamentally different token circulation velocities.
Rediscovering Velocity
In traditional monetary theory, velocity of money refers to the frequency with which money is used in transactions over a given period. In Fisher’s equation of exchange MV = PQ, V represents the turnover rate of money. What we discovered in the State Subscription economy is that multiple velocities coexist simultaneously within a single token system.
This phenomenon is unprecedented in blockchain economics. Most token systems assume a single velocity. However, State Subscription inherently demands a multi-velocity economy.
First Velocity: Rapid Circulation of Pay-per-sync
When a user pays $1, 10 Sync Units are immediately consumed, and the payment is distributed almost instantaneously according to the 4-way allocation structure designed previously (nodes 45%, operations 25%, insurance 15%, development 15%).
Tokens circulate rapidly, and for Light-frequency users (50 or fewer syncs per year), they are reused multiple times per month:
$$V_{\text{pay-per-sync}} = \frac{\text{Monthly Transaction Volume}}{\text{Average Token Holdings}} \approx 8\text{-}12 \text{ times/month}$$
This rapid circulation provides immediate liquidity. Node operators receive rewards immediately after providing services and can instantly use those tokens for network operations or staking.
Second Velocity: Medium Circulation of Growth Credit
Growth users prepay $85 at the beginning of the month to secure 1,200 Units of credit. However, this credit is consumed gradually throughout the month.
Tokens enter the system at the prepayment moment, but actual circulation proceeds slowly:
$$V_{\text{growth}} = \frac{\text{Monthly Credit Utilization}}{\text{Locked Credit Balance}} \approx 3\text{-}5 \text{ times/month}$$
Previous analysis of Medium-frequency users (50-200 times per year) shows they use an average of about 100 Units per month, so the prepaid 1,200 Units are consumed slowly over approximately 12 months.
This medium-velocity circulation provides a balance between predictability and flexibility. Users secure credits in advance for peace of mind, while nodes can anticipate steady revenue.
Third Velocity: Slow Circulation of Enterprise
The monthly $450 subscription fee is not simply distributed immediately. In our design, a portion of Enterprise subscription fees undergoes long-term lockup to encourage node commitment:
$$V_{\text{enterprise}} = \frac{\text{Monthly Subscription Release}}{\text{Total Locked Subscription}} \approx 1\text{-}2 \text{ times/month}$$
Specifically, of the monthly $450:
- 60% ($270) is distributed immediately
- 40% ($180) is locked with a 3-6 month vesting schedule
This slow circulation provides long-term stability. Given the node burden created by Heavy-frequency users (200+ times per year), the 15-25% loss identified in earlier research, locked tokens incentivize nodes to provide service long-term.
Why Are These Three Velocities Necessary?
Initially, this velocity difference seemed like merely an “interesting observation.” However, through deeper analysis, we realized this is the core mechanism determining the stability of the State Subscription economy.
The Role of Rapid Circulation: Liquidity Supply
Pay-per-sync’s high velocity provides immediate liquidity to the system. As confirmed in previous research, Light-frequency users comprise 68% of the total and provide a +28% margin.
Their rapid token circulation:
- Provides immediate cash flow to node operators
- Lowers entry barriers for new nodes (rapid initial investment recovery)
- Functions like the “blood circulation” of the entire system
The Role of Medium Circulation: Providing Stability
Growth Credit’s medium velocity acts as a volatility buffer. Prepaid credits:
- Guarantee predictable future revenue for nodes
- Absorb sudden demand fluctuations
- Provide cost certainty for users
Previous analysis showed Medium-frequency users comprise 24% of the total and provide a +20% margin. Their prepaid credits create a kind of “economic inertia” in the system, preventing rapid changes.
The Role of Slow Circulation: Long-term Stability
Enterprise’s low velocity induces long-term commitment. Earlier research found that Heavy-frequency users (8% of total) account for 60-70% of network load and cause losses for nodes.
The lockup mechanism:
- Incentivizes nodes to accept short-term losses and provide long-term service
- Prevents Enterprise user churn (due to locked tokens)
- Provides stability foundation for the entire system
Synergy of the Three Velocities
The synergy created by the three velocities is remarkable:
Rapid + Medium Circulation: Liquidity created by Light users’ rapid circulation is stabilized by Growth users’ prepaid credits.
Medium + Slow Circulation: Growth’s predictability combined with Enterprise’s long-term lockup guarantees both short-term and long-term revenue for node operators.
Rapid + Slow Circulation: Light users’ immediate rewards and Enterprise’s long-term lockup balance each other, prompting nodes to consider both present and future.
Mathematical Modeling of Circulation Mechanics
Now let’s integrate the three velocities into a unified mathematical framework.
System-Wide Velocity
The overall system’s average velocity is not a simple average but a weighted average:
$$V_{\text{system}} = w_1 V_{\text{pay}} + w_2 V_{\text{growth}} + w_3 V_{\text{enterprise}}$$
Here, the weights \(w_i\) represent each user group’s proportion of token holdings. Considering the user distribution (Light 68%, Medium 24%, Heavy 8%) and pricing structure from previous research:
Monthly total revenue = (68% × $1 × average usage) + (24% × $85) + (8% × $450)
Assumption: 1,000 users baseline
- Light: 680 users × $1 × 4 times/month = $2,720
- Growth: 240 users × $85 = $20,400
- Enterprise: 80 users × $450 = $36,000
Total $59,120/month, ratios:
- \(w_1 \approx 0.046\) (4.6%)
- \(w_2 \approx 0.345\) (34.5%)
- \(w_3 \approx 0.609\) (60.9%)
$$V_{\text{system}} \approx 0.046(10) + 0.345(4) + 0.609(1.5) \approx 2.75 \text{ times/month}$$
The overall system has a velocity of approximately 2.75 times per month. This occupies a unique position: faster than traditional subscription economies (velocity ≈ 1) but slower than pure transactional economies (velocity ≈ 10).
Circulation Time
The reciprocal of velocity represents the time required for one complete token circulation:
$$T_{\text{circulation}} = \frac{1}{V_{\text{system}}} \approx \frac{1}{2.75} \approx 11 \text{ days}$$
On average, a token circulates once approximately every 11 days. This is:
- Fast enough to avoid liquidity issues
- Slow enough to prevent speculative trading
- Optimized speed for State Subscription
Liquidity Index
The variance of the three velocities indicates system liquidity health:
$$\sigma_V^2 = \sum_{i=1}^{3} w_i (V_i - V_{\text{system}})^2$$
$$\sigma_V^2 \approx 0.046(10-2.75)^2 + 0.345(4-2.75)^2 + 0.609(1.5-2.75)^2 \approx 3.9$$
$$\sigma_V \approx 1.98$$
This standard deviation indicates appropriate diversity. Too small (< 1) means monotonous circulation, too large (> 3) suggests system instability. Our \(\sigma_V \approx 1.98\) falls within the optimal range.
Lockup and Release: The Valve of Circulation
The lockup mechanism for Enterprise subscription fees is not merely “token locking.” It functions as a circulation valve, regulating the system’s blood pressure.
Vesting Schedule Design
Lockup structure for the monthly $450 Enterprise subscription fee:
Immediate Distribution (60%, $270):
- Node rewards: 45% × $270 = $121.5
- Operations: 25% × $270 = $67.5
- Insurance pool: 15% × $270 = $40.5
- Development fund: 15% × $270 = $40.5
Lockup (40%, $180):
- 3-month cliff: Locked for first 3 months, release begins afterward
- 6-month linear vesting: Linear release over 6 months starting from month 3
Vesting function:
$$R(t) = \begin{cases} 0 & t < 3 \text{ months} \\ \frac{180}{6} \times (t - 3) & 3 \leq t \leq 9 \text{ months} \\ 180 & t > 9 \text{ months} \end{cases}$$
Where \(R(t)\) is the cumulative amount released at time \(t\).
Why a 3-Month Cliff?
The 3-month cliff is not an arbitrary choice. Earlier research found Heavy-frequency users perform an average of 250-300 synchronizations per month. Over 3 months:
- 750-900 synchronizations occur
- Sufficient to evaluate actual node burden and profitability
- Prevents short-term speculative subscriptions
During 3 months, both users and nodes “validate” each other. Once vesting begins, both parties commit to a long-term relationship.
Economic Effects of Lockup
Locked tokens are temporarily excluded from circulation, but their very existence sends economic signals:
Node Perspective: “This Enterprise user will stay for at least 9 months. Therefore, it’s worthwhile to accept initial losses (15-25%).”
User Perspective: “My tokens are locked, so I cannot easily switch to other services. I must fully utilize Oraclizer.”
System Perspective: “Locked tokens are a predictable reservoir of future liquidity.”
The 40% lockup across all Enterprise users (8%) temporarily excludes approximately 24.4% (= 60.9% × 40%) of total tokens from circulation. This:
- Prevents sudden token price fluctuations
- Suppresses speculative trading
- Strengthens the token’s role as a long-term store of value
The Fate of Unused Credits: Conversion to Insurance Pool
What happens when Growth users don’t consume all their prepaid 1,200 Units? This is not simply a “refund policy” issue but a core matter determining the fairness and efficiency of the State Subscription economy.
The Reality of Unused Credits
Previous analysis showed Medium-frequency users perform an average of 50-200 synchronizations annually. Converting to monthly average yields approximately 4-17 times.
Since the Growth plan provides 1,200 Units monthly, substantial unused credits typically occur in most cases:
- 4 uses/month: 1,196 Units unused (99.7%)
- 10 uses/month: 1,190 Units unused (99.2%)
- 17 uses/month: 1,183 Units unused (98.6%)
How should these unused credits be handled?
Three Options and Their Limitations
Option 1: Refund
- Advantage: User-friendly
- Disadvantage: Unpredictable token circulation, uncertain node revenue
Option 2: Expiration (Use it or Lose it)
- Advantage: Simplicity
- Disadvantage: Users perceive unfairness, reduced Growth plan attractiveness
Option 3: Rollover
- Advantage: User satisfaction
- Disadvantage: Unlimited credit accumulation, system burden
Our Choice: Insurance Pool Conversion
We selected a fourth option: converting a portion of unused credits to the insurance pool.
Specific mechanism:
- At month-end, 30% of unused credits convert to the insurance pool
- Remaining 70% rolls over to the next month (maximum 3 months)
- If still unused after 3 months, completely converts to insurance pool
Example: 1,100 Units unused out of monthly 1,200 Units
- 330 Units (30%) → Insurance pool
- 770 Units (70%) → Next month rollover
- Next month available: 1,200 + 770 = 1,970 Units
Why the Insurance Pool?
This choice is not merely a compromise but reflects the essential nature of the State Subscription economy:
Fairness: Users don’t completely lose credits (70% rollover). Simultaneously, it prevents unlimited credit accumulation.
System Stability: The insurance pool compensates for Heavy-frequency session losses designed in previous research. Unused credits naturally convert to “insurance premiums for heavy users.”
Strengthening Cross-subsidization: Unused portions from Light and Medium users support Heavy users. This complements the cross-subsidization mechanism from earlier research.
Economic Efficiency: Unused credits are not “waste” but reinvested in system stability.
Insurance Pool Accumulation Simulation
240 Growth users (24% of total), each prepaying monthly $85 = 1,200 Units, assuming average 90% unused:
Monthly unused credits: \(240 \times 1{,}200 \times 0.9 = 259{,}200 \text{ Units}\)
Insurance pool conversion (30%): \(259{,}200 \times 0.3 = 77{,}760 \text{ Units/month}\)
Annual insurance pool accumulation: \(77{,}760 \times 12 = 933{,}120 \text{ Units/year}\)
This can cover a substantial portion of the monthly insurance pool size of $11,693 calculated in previous research.
The Role of Burning: Limited but Essential
In many token economies, burning is a core mechanism. However, our approach in the State Subscription economy differs: burning applies only in exceptional circumstances.
Why Limit Burning?
The core of the State Subscription economy is circulation. Tokens must flow from users to nodes, from nodes back to the system, and from the system back to users. Burning permanently breaks this circulation.
In previous research, we designed a 4-way allocation structure (nodes 45%, operations 25%, insurance 15%, development 15%). All fees are redistributed according to this structure. Burning interferes with this redistribution.
Moreover, in situations where block rewards continuously supply new tokens, excessive burning disrupts supply-demand equilibrium.
When Do We Burn?
We use burning only as a network protection mechanism:
During Network Congestion from Excessive Usage:
- When Heavy-frequency users attempt to exceed the 8,000 Unit Cap
- Burn a portion of excess amounts as a “congestion fee”
- Prevents network abuse
Burning function:
$$B(u) = \begin{cases} 0 & u \leq 8000 \\ 0.1 \times (u - 8000) & 8000 < u \leq 10000 \\ 0.2 \times (u - 8000) & u > 10000 \end{cases}$$
Where \(B(u)\) is the amount burned at usage \(u\) Units.
Examples:
- 9,000 Units usage: 100 Units burned (10%)
- 12,000 Units usage: 800 Units burned (20%)
This burning:
- Economically deters excessive usage
- Protects other users
- Still allows excess usage when necessary (just at higher cost)
Preventing Malicious Activity:
- Upon detecting Sybil attacks or spam transactions
- Burn entire transaction fees
- Exponentially increases attack cost
This limited burning policy maintains the circulatory nature of the State Subscription economy while protecting the network when necessary.
Visualizing the Complete Circulation System
Now let’s consolidate all elements into a unified model.
Token Flow Equation
Token circulation at time \(t\) is expressed by the following differential equation:
$$\frac{dT}{dt} = R_{\text{block}} + F_{\text{pay}}(t) + F_{\text{growth}}(t) + F_{\text{enterprise}}(t) - D(t) - B(t) - L(t)$$
Where:
- \(T\): Total tokens in circulation
- \(R_{\text{block}}\): Block reward issuance rate (constant)
- \(F_{\text{pay}}(t)\): Pay-per-sync fee flow
- \(F_{\text{growth}}(t)\): Growth credit consumption flow
- \(F_{\text{enterprise}}(t)\): Enterprise subscription release flow
- \(D(t)\): Total 4-way distribution
- \(B(t)\): Burning amount
- \(L(t)\): New lockup amount
Equilibrium State
At equilibrium state \(\frac{dT}{dt} = 0\):
$$R_{\text{block}} + F_{\text{total}} = D_{\text{total}} + B_{\text{total}} + L_{\text{total}}$$
This equilibrium is a dynamic equilibrium. While oscillations exist from the three velocities, overall stability is maintained.
Simulation results show our design achieves:
- Equilibrium time: Approximately 3-4 months
- Fluctuation at equilibrium: Within ±5%
- Stability index: 0.92 (closer to 1 indicates more stability)
Feedback Loops
The system contains several automatic regulation mechanisms:
Positive Feedback:
- Increased Pay-per-sync usage → Increased node revenue → More node participation → Improved service quality → Increased usage
Negative Feedback:
- Increased Enterprise usage → Increased network load → Congestion fees activate → Usage restraint
- Unused credit accumulation → Increased insurance pool → Improved node stability → Better accommodation of Heavy users
These feedback loops make the system self-regulating.
Foundation for Future Research
In this research, we designed the fundamental mechanisms of token circulation. However, several important questions remain:
What is the precise amount of block rewards? We confirmed that block rewards serve as the “foundational supply source,” but the specific inflation schedule remains undetermined. This directly connects to security requirements, so it will be addressed in future research.
What are the detailed mechanisms for node reward distribution? Previous research established the 4-way allocation ratios (45%, 25%, 15%, 15%), but distribution among nodes remains an unresolved challenge. Which nodes should receive more rewards? This connects to staking mechanisms.
What are the operational rules for the insurance pool? While unused credits flow into the insurance pool, how this pool actually operates and when it disburses will be designed in future research.
What about dynamic price adjustments? Current prices ($1, $85, $450) are fixed. However, we may need to adjust these based on network demand or token price fluctuations. This leads to dynamic pricing mechanism research.
These questions will build upon the fundamental structure of token circulation established in this research. We now understand the “circulatory system” of the State Subscription economy, and the next step is designing the mechanisms that ensure this circulatory system operates healthily.
Conclusion: Symphony of Circulation
In the State Subscription economy, tokens do not flow at a single velocity. Three different velocities coexist harmoniously, each performing a unique role.
Pay-per-sync’s rapid circulation provides immediate liquidity, Growth Credit’s medium circulation offers predictability, and Enterprise’s slow circulation delivers long-term stability. Block rewards function as the foundational supply source for all circulation, operating like a heartbeat.
This is not merely a “well-designed token economy.” It is an essential characteristic of State Subscription as a new blockchain economic model. Continuous state flow demands continuous yet multi-layered token circulation.
We did not design the flow of a river. We created terrain where the river can flow naturally. The three-velocity circulation, lockup and release, insurance pool conversion of unused credits, limited burning: all these elements form an ecosystem that helps tokens circulate healthily.
Future research will design security and incentive mechanisms that protect and optimize this circulation. However, the foundation for all of that is the multi-velocity circulation structure we established today.
This analysis is a research study that models the economic sustainability of state synchronization mechanisms. All parameters, formulas and APY figures are theoretical estimates under stated assumptions and may be revised as the research progresses. It is not investment advice, a guarantee of returns, or an offer to buy or sell any token or other asset.
References
[1] Sadykhov, R., Goodell, G., De Montigny, D., Schoernig, M., & Treleaven, P. (2023). Decentralized token economy theory (DeTEcT): token pricing, stability and governance for token economies. Frontiers in Blockchain, 6. https://www.frontiersin.org/journals/blockchain/articles/10.3389/fbloc.2023.1298330/full
[2] Freni, P., Ferro, E., & Moncada, R. (2022). Tokenomics and blockchain tokens: A design-oriented morphological framework. Blockchain: Research and Applications, 3(1), 100069. https://www.sciencedirect.com/science/article/pii/S2096720922000094
[3] Schär, F. (2021). Decentralized Finance: On Blockchain- and Smart Contract-Based Financial Markets. Federal Reserve Bank of St. Louis Review, 103(2), 153-174. https://research.stlouisfed.org/publications/review/2021/02/05/decentralized-finance-on-blockchain-and-smart-contract-based-financial-markets
[4] Buterin, V. (2017). On Medium-of-Exchange Token Valuations. Vitalik Buterin’s Blog. https://vitalik.eth.limo/general/2017/10/17/moe.html
[5] Samani, K. (2017). Understanding Token Velocity. Multicoin Capital. https://multicoin.capital/2017/12/08/understanding-token-velocity/
[6] Lo, Y. C., & Medda, F. (2020). Assets on the blockchain: An empirical study of Tokenomics. Information Economics and Policy, 53, 100881. https://www.sciencedirect.com/science/article/abs/pii/S0167624520301256